

The customer data platform built exclusively for multi-unit restaurants.

Gas prices climbed steadily earlier this year, hitting ~$4.50 per gallon in May. It wasn't the most dramatic spike in recent history — 2022's run to nearly $5 per gallon still holds that distinction — but it was enough to resurface a familiar conversation about how fuel costs ripple through consumer spending, and specifically, through restaurant traffic.
That conversation got louder on earnings calls. McDonald's CEO Chris Kempczinski noted that "elevated gas prices, which is the core issue that I think we're all seeing about in the press right now... is going to disproportionately impact low-income consumers." Applebee's CEO John Peyton put a number on it: "We know that when gas prices start to go past $3.50, that affects that [value conscious] guest for us." Wingstop attributed its domestic comp weakness to "winter weather and higher gas prices hitting low-income consumers." Chili's CEO Kevin Hochman pointed to "the geopolitical events and then obviously the gas prices that ensued," noting customers were trading down within visits — fewer drinks, skipping appetizers.
We were curious to see whether the macro signals dominating the industry conversation showed up the same way when you look at performance for brands on Bikky.
Bikky transaction data
We pulled monthly transactions and average check for brands on Bikky to track same store growth in both metrics since 2021. Brands were included if they met the following criteria:
We analyzed each brand's top 3 states by location count, requiring at least 10 locations per state.
Macro data
We built a parallel database of monthly gas prices and unemployment rates by state, sourced from the EIA and BLS, starting from January 2021. We included unemployment as a second macro variable to see if average check or transaction growth in our data set showed correlation with any broader macro factors.


For each brand and state, we ran Pearson correlations across 8 metric combinations — gas price and unemployment, each correlated against transactions and average check, month-over-month and year-over-year, with same-month and lagged comparisons up to 2 months — producing 1,392 total correlations.
We classified results as strong, moderate, or weak based on the size and statistical significance of each relationship. A strong result required both a meaningful effect size and statistical significance, meaning a relationship this strong would be unlikely - under a 5% probability - if no real relationship existed.
Across the brand-market combinations we tested, neither gas prices nor unemployment produced a consistent, directional relationship with restaurant performance.
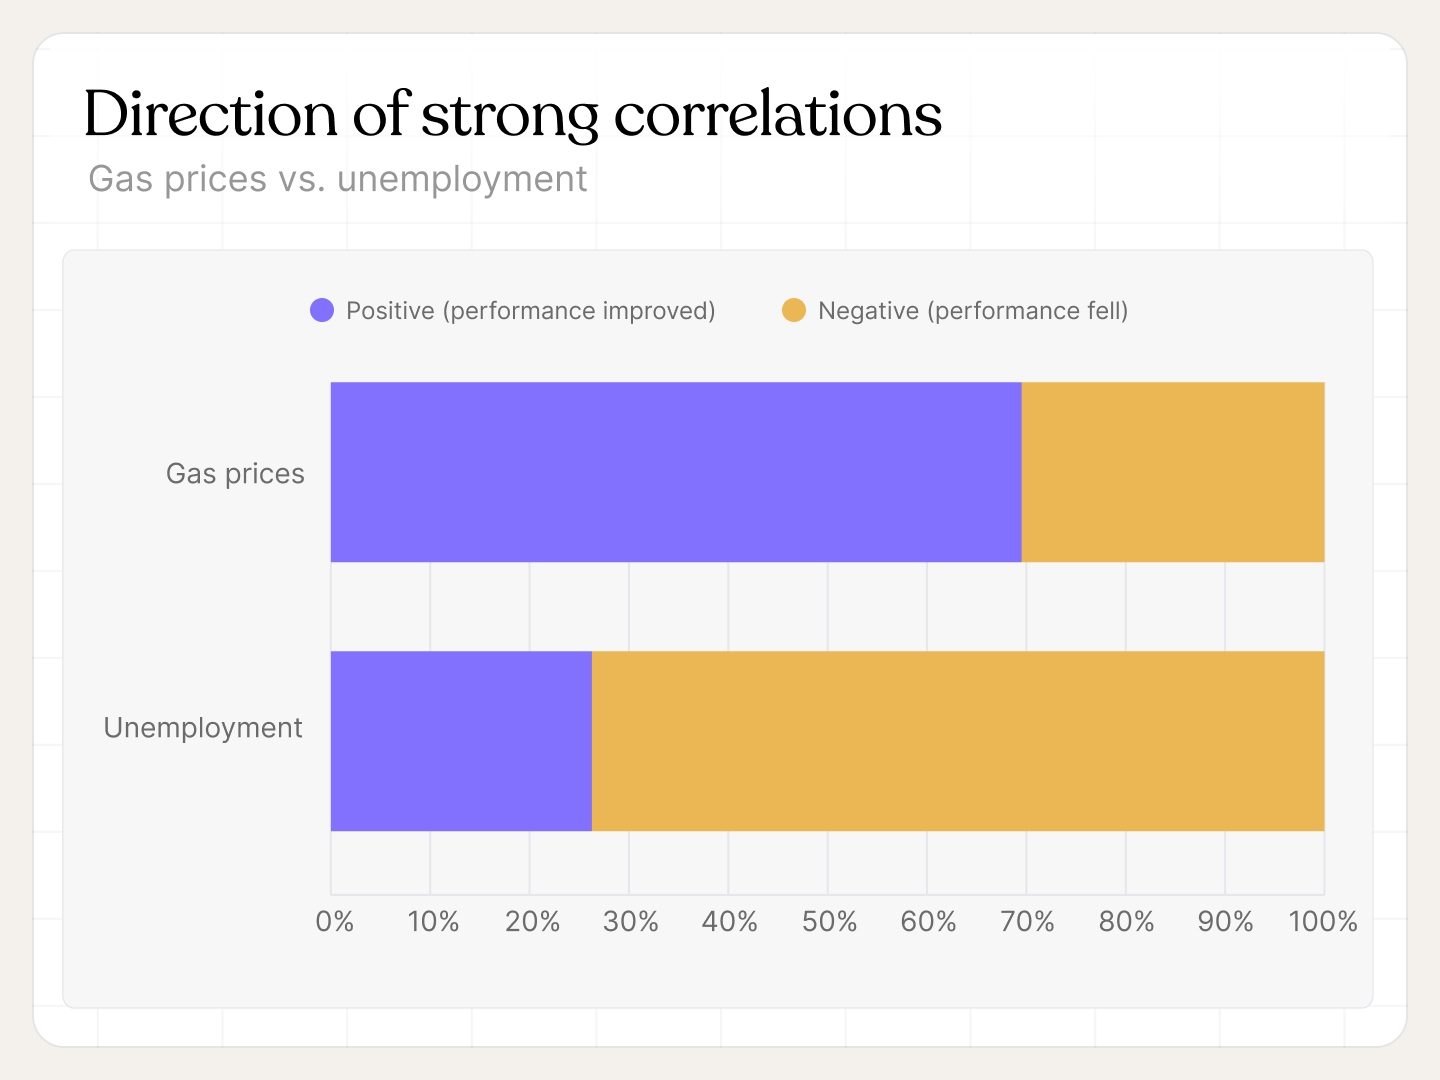
When we look at gas prices specifically, the signal was weak and pointed both ways: in some brand-market combinations performance rose as gas prices climbed, in others it fell, with no consistent direction. There's no clear story in our data that gas prices alone affect restaurant traffic or check size.
Unemployment did show a more consistent pattern. Among correlations that were strong enough to flag, 76% were negative — meaning when unemployment rose, performance fell. The signal was broader than gas prices, but still limited to a small subset of brands and markets.
The brands that cited gas prices as a headwind in Q1 were likely experiencing something real, but across the brand-market combinations we tested, the signal was not consistent or directional: in some markets performance improved as gas prices rose, while in others it fell.
That inconsistency is itself informative. If gas prices were a uniform headwind, you'd expect the signal to be strong and directionally consistent — performance falling as prices rise across the markets where it showed up at all. The fact that it cuts both ways tells us gas prices alone can’t explain performance in most markets.
To check whether that was specific to gas or part of a broader economic sensitivity, we included unemployment as a second macro variable. Its signal was more consistent than gas — but still limited to a subset of brands and markets, so we'd treat it as something worth watching alongside your own data, not a standalone indicator to act on. Taken together, the fact that neither macro variable explains performance for most brands suggests the bigger drivers could sit at the brand and market level — positioning, demographics, local market conditions, competitive set.
A few things worth keeping in mind: we only tested two macro variables across a specific set of brands, and we didn't control for those brand-level factors directly. And because macro conditions move slowly and steadily, any single market gives us a limited number of truly independent data points — so we read these as directional signals about where to look, not precise measures of effect. A larger dataset would give us more confidence in the findings.
What this analysis does offer is something the public data can't: a location-level view across a broad set of brands. Earnings call commentary and industry benchmarks aggregate performance across thousands of locations and dozens of markets. They can tell you what happened on average. They can't tell you what's happening in your markets, with your guests, at your price point. That's where the most useful signal lives, and it's worth checking consistently as macro conditions continue to shift.
Gas prices rose steadily through early 2026, and the conversation on earnings calls reflected that. But when we looked at the relationship between gas prices and restaurant performance at the location level in our dataset, across a broad set of brands and markets, we didn't see it show up consistently.
When performance shifts, there can be an instinct to look outward first at macro headwinds, competitor activity and seasonal patterns. But the most useful signals tend to be closer to home. Monitoring metrics like visit frequency, average check trends by guest segment, return rate, and channel mix during periods of economic pressure can help you understand whether an external factor is actually showing up in your business, or whether something else is driving the change.
Macro conditions will keep shifting. Keeping a consistent read on your own guest behavior as they do is what allows you to separate the signal from the noise.
The customer data platform built exclusively for multi-unit restaurants.