

The customer data platform built exclusively for multi-unit restaurants.
52% of consumers cite appealing LTOs as a major factor in choosing where to eat. For operators, LTOs are strategic investments that can drive traffic, attract new guests, and build long-term loyalty.
But here's the challenge: most restaurants are only seeing half the picture when it comes to measuring LTO performance.
When evaluating a new menu item's performance, most brands turn to their PMIX report. The problem is, two people can look at the same PMIX data and reach completely different conclusions.
You've probably experienced some version of this: your bacon burger LTO is sitting at 5% of sales. Marketing calls it a win because they hit their target mix percentage. Operations pushes back, questioning whether it's worth training staff on a new item that represents such a small portion of sales. Finance wants to know if the unique sourcing and pricing made it profitable. And leadership is left wondering: was this actually successful?
Your menu is your product, and being opinionated about it is a good thing. The problem is that PMIX data, while useful, only tells part of the story.
Before diving into the data, ask yourself: what was the intention of this LTO?
Your intention shapes how you assess the metrics. Here are three things to look at:
Compare the retention rate of new guests who ordered the LTO on their first visit versus those who ordered a core menu item. If LTO buyers are returning at a higher rate, the item is working as an acquisition hook.
Approximately 80% of first-time guests never return. But getting a guest from their first to second visit dramatically increases the likelihood they'll come back for a third and fourth, making first-visit retention one of the most critical metrics for long-term growth.
.png)
Example: A QSR brand launched a spicy chicken sandwich that sat at just 2-3% of sales. New guests who ordered it showed a 2.7 percentage point higher retention rate and and placed approximately 0.5 additional orders over their first 90 days compared to guests who ordered other items.
How to interpret based on your intent:
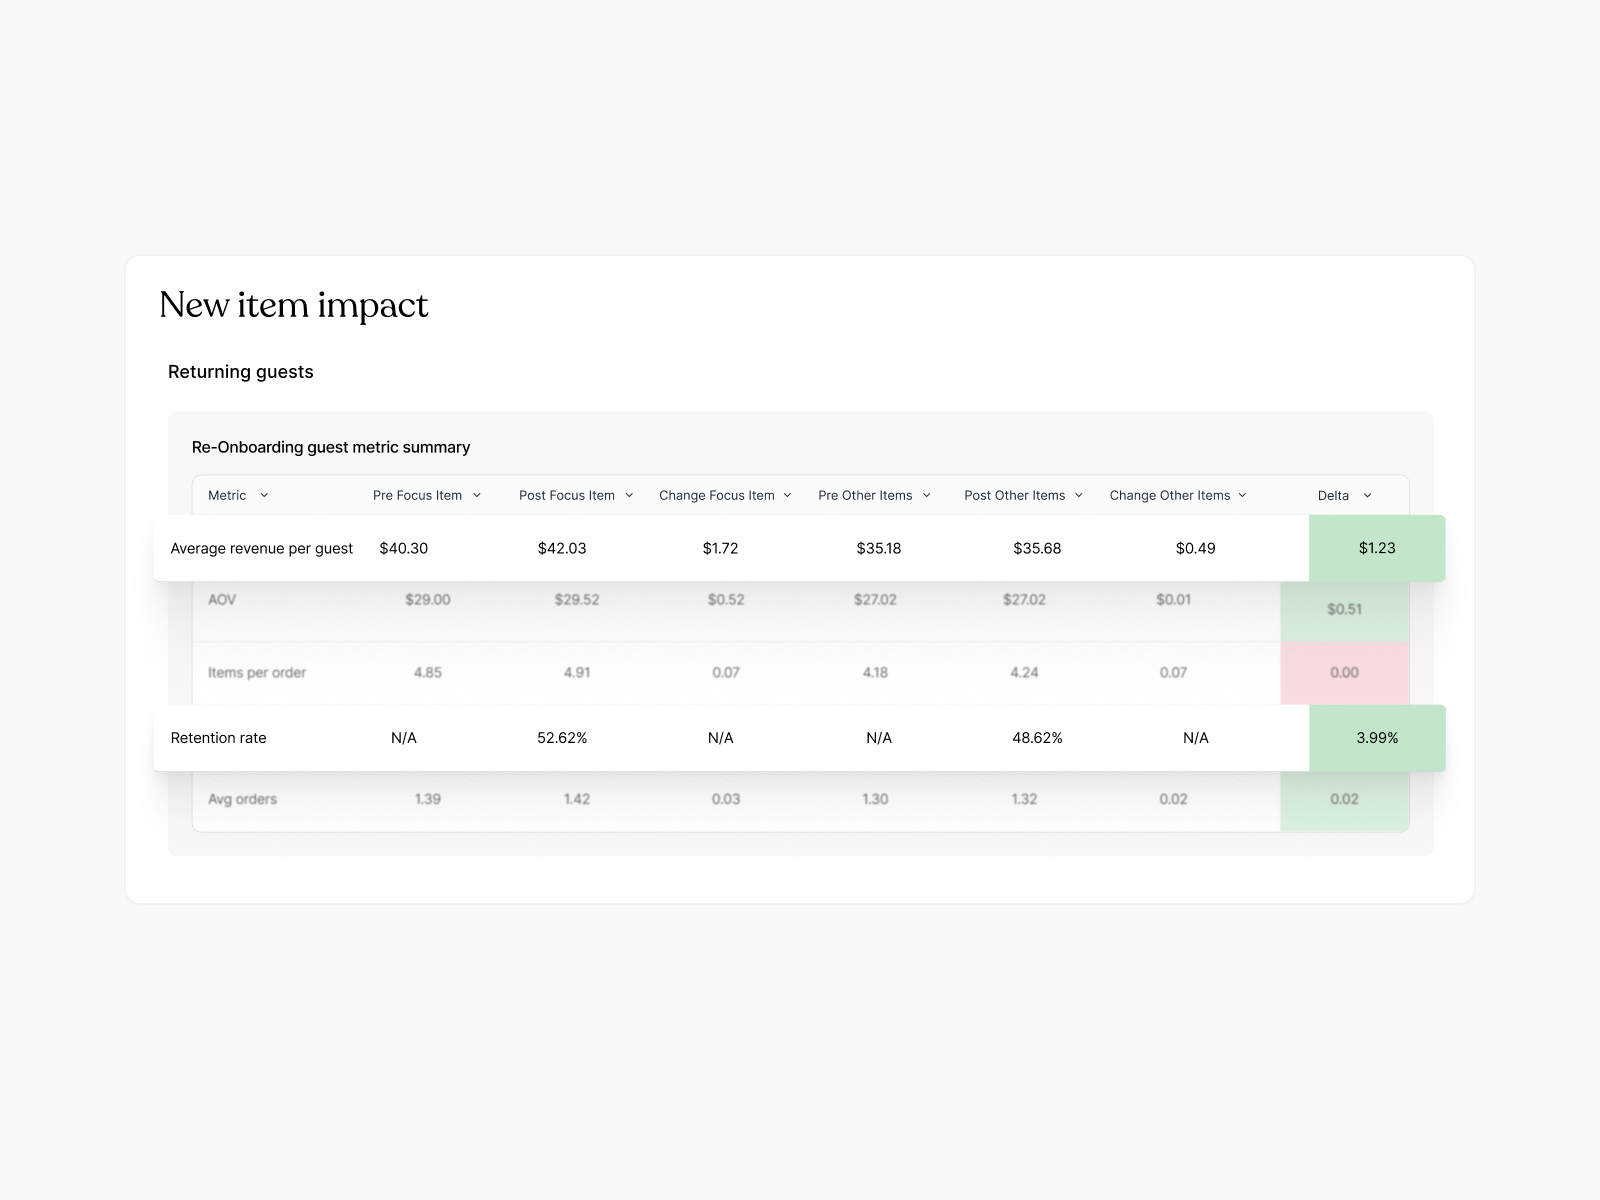
Compare retention rate and average orders for returning guests who ordered the LTO versus those who didn't. If LTO buyers are coming back more often, you're getting incremental visits, not just shifting demand.
Example: For that same spicy chicken sandwich, repeat guests who ordered it showed a 23% higher retention rate (79% vs. 55%) and placed 1.19 additional visits over their lifetime.
Here's how that translates to incremental revenue:
The item was also particularly effective at bringing back lapsed guests, a 25 percentage point increase in re-engagement.
.png)
How to interpret based on your intent:
Look at how the LTO is affecting sales of other menu items. If your hero items dropped, you may be shifting demand rather than creating it.
Cannibalization isn't automatically bad. If you're losing a small share on one of your hero items but gaining frequency and retention, that's a trade-off worth making.
Example: The spicy chicken sandwich cannibalized the brand's classic chicken sandwich, which dropped from 51% to 42% of category sales. But because the new item drove meaningful retention lifts for both new and repeat guests, the trade-off was worth it.
.png)
How to interpret based on your intent:
LTO performance is easiest to evaluate when you measure it against the goal of the launch.
Whether that’s to bring in new guests, give loyal customers a reason to return more often, or test a new category or seasonal traffic driver, the metrics you prioritize should reflect that intention.
That’s why focusing on behavior, not just volume, can reveal the most meaningful signals:
Answer these questions, and you'll get a much clearer view of which LTOs are driving incremental growth versus short-term noise. Because the most valuable menu items aren’t always your biggest sellers, but the ones that increase frequency, build loyalty, and grow guest lifetime value over time.
The customer data platform built exclusively for multi-unit restaurants.